Those of you who have spent even the slightest amount of time digging around for insights on embedded storage technologies know this: the subspace of the Internet devoted to this particular topic is flooded with short articles comparing NOR and NAND Flash technologies. Some are very well-written and genuinely enlightening. But all too often, the sheer accumulation of bland, dry, contextless content leaves you wanting more. Unless, perhaps, there is nothing more? Unless these few bits of profusely repeated material are all there is to be known? We don’t think so.
This third article of our introduction series (See part 1 and part 2) on flash storage is our own version of the “NOR versus NAND” classic. A version that will, hopefully, elevate your understanding of these widespread storage technologies and help you make better design decisions. That said, this article is not a didactic, self-contained, introductory text. It is more of a complement to the usual introduction, covering aspects of NOR and NAND flash technologies that, in our view, are too often ignored. If you are completely new to NOR and NAND flash technologies, you might first want to go through more neutral material like Wikipedia’s articles on the same topic. On the other hand, if you already have extensive knowledge of these technologies, you may still find useful (even, perhaps, surprising) bits of information in this article.
Beyond Numbers
Table 1 is a side-by-side comparison of the NOR and NAND flash technologies based on various performance metrics. Although these numbers may significantly vary across actual devices, they are plausible and can serve as a valuable reference.
| NOR | NAND | |
|---|---|---|
| Write Throughput | 1 MB/s | 10 MB/s |
| Read Throughput | 40 MB/s | 30 MB/s |
| Erase Throughput | 0.1 MB/s | 300 MB/s |
| Erase-Write Throughput | 100 KB/s | 10 MB/s |
| Read Granularity | Byte | Page (4KiB typical) |
| Write Granularity | Byte (typical) | Page (4 KiB typical) |
| Erase Granularity | Block (64 KiB typical) | Block (256 KiB typical) |
| Write Energy Consumption | 1uJ/byte | 10nJ/byte |
| Read Energy Consumption | 1nJ/byte | 1nJ/byte |
| Erase Energy Consumption | 600nJ/byte | 0.2nJ/byte |
But as useful as they are, numbers without a proper interpretation are meaningless, if not downright misleading. Raw performance numbers make for good marketing because they are easily stated and understood (at least superficially), but they do not carry much relevant information from an application design perspective.
Let us illustrate what we mean through a concrete example: write performances. Table 1 suggests that writing is much faster on NAND than it is on NOR. In fact, this is a specious claim that resurfaces all too often. Sure, there is some truth to it. But it is also utterly reductive and paves the way to bad design decisions. Let’s have a closer look.
NOR flash allows for byte-level write accesses. NAND, on the other hand, has a much coarser write granularity. On NAND flash, data can only be written in pages, typically 4 KiB at a time for NAND SLC (8 KiB or more for NAND MLC). In the event of a small write access (say 512 bytes), a whole page must be loaded in RAM, modified and written back. In the end, more data is written than actually modified. This phenomenon is commonly referred to as write amplification. In our (very plausible) example, the write amplification is 8 (4 KiB page/512-byte access). Given a workload dominated by such small accesses, the effective write throughput would suffer an 8-fold drop. This is quite a lot. But there is more.
Before data can be written, a file system (or database) must first find it. The lookup process can be more or less efficient depending on the file system and the amount of cache available, among other factors. Still, each write access typically comes with its share of corresponding read accesses. On NOR flash, read accesses are very fast. They are characterized by near-zero latency and very high throughput. Most importantly, read accesses are performed at the byte level. This is particularly beneficial to the data lookup process because file systems’ internal structures tend to be made of small and scattered pieces of data.
On the other hand, random read accesses on NAND flash are significantly slower. And much like write accesses, they are performed at the page level. For small accesses, this leads to some amount of waste as a whole page must be loaded anyway. This additional overhead referred to as read amplification, limits write performances on NAND, something that is not immediately obvious when looking at Table 1.
Putting it all together, we see that the respective net write performances (i.e. accounting for read/write amplification and lookup overhead) of NOR and NAND technologies are not as widely different as raw performance numbers first seem to indicate. Most importantly, it makes it clear that a thorough performance assessment cannot be made without taking into account the application access patterns, including the access size and distribution across the whole data set.
Grass is Green, Sky is Blue, NOR Is For Code, NAND Is For Data
There is a tenacious misconception that we hear every now and then to the effect that NOR flash is for code while NAND flash is for data. It is true that NOR flash is more commonly used than NAND flash for code storage. There are two main reasons for this. First, byte-level access granularity allows for in-place code execution, which is an indisputable asset for small embedded systems. Second, for small to medium firmware sizes (say under 64Mbits), NOR simply makes more sense economically as the smallest available NAND devices are significantly more expensive.
That said, many of our customers use NOR flash for data storage. And for good reason. In the case of read-intensive applications, NOR offers a significantly higher throughput than NAND. Even for applications with heavy write workloads, NOR can be a reasonable choice. With byte-level access and high read throughput, NOR is particularly well-suited for workloads dominated by small random write accesses. Up to a point where net write performances can approach (sometimes even exceed) those obtained on NAND flash. This is especially relevant for small data sets, where the economic argument adds up to definitely tilt the balance in favour of NOR flash.
A Word About Cost
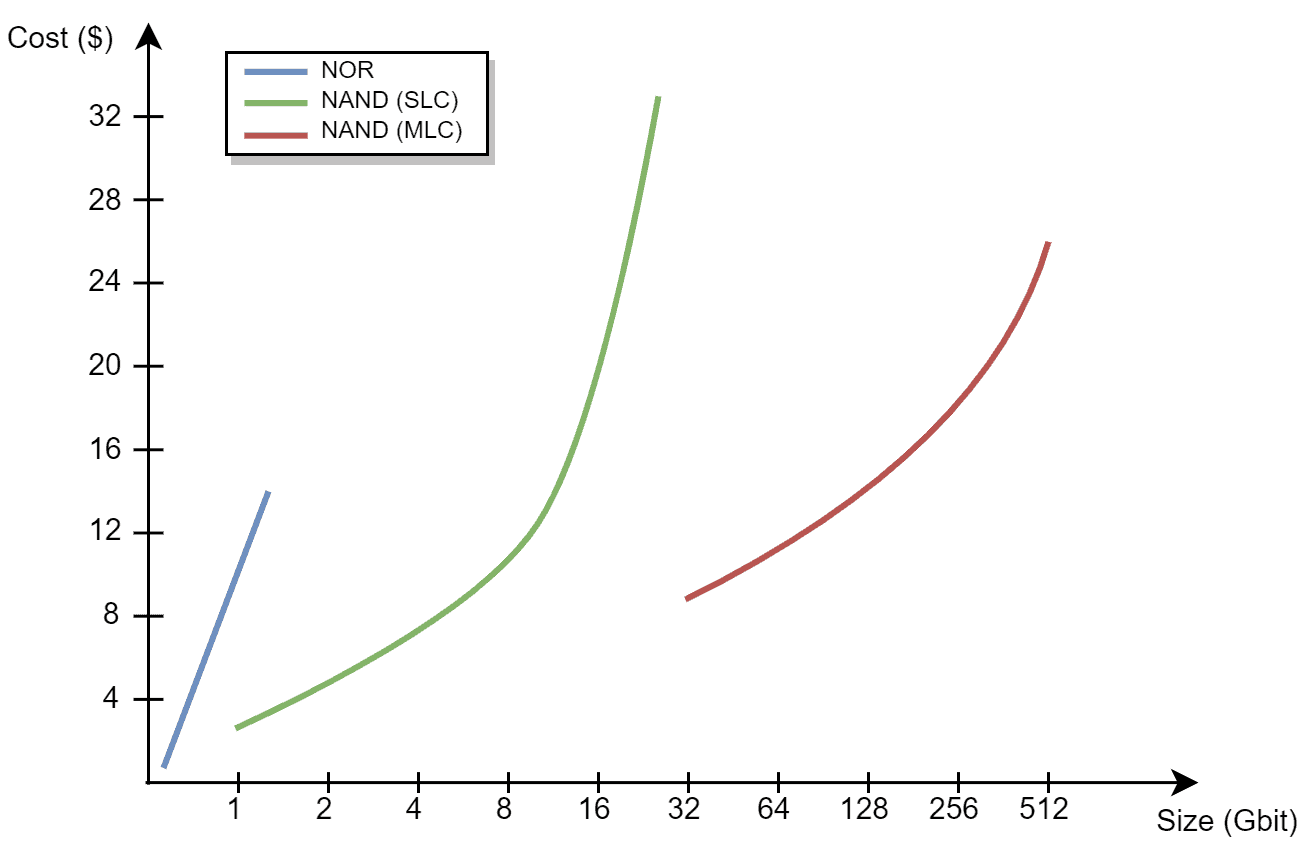
As mentioned in the previous section, NOR Flash makes sense for small capacities since even the smallest NAND are significantly larger and more costly than small NOR Flash devices. Figure 1 shows the cost as a function of capacity for NOR, SLC and MLC NAND devices.

As can be seen from Figure 1, however, even the smallest NAND Flash device can be significantly cheaper than a medium-sized NOR. As such, the choice between NOR and NAND must be guided by both cost and requirements considerations.
Want More?
What we have covered in this article is barely the tip of the iceberg. Hopefully, though, we have shown how NOR and NAND flash technologies differ from an application design perspective and how raw performance numbers can be interpreted to make better design decisions.
If you would like to read more about NOR and NAND flash technologies, performance assessment, and other advanced storage-related topics, the TREEspan User Manual contains a wealth of information, both general and specific to the TREEspan File System (TSFS).
As always, thank you for reading. If you have any questions or comments regarding this article or other embedded topics, please feel free to reach out to us.